
Here is an exercise in mapping a system using a causal loop diagram. See Power of Exponential
Read the following paragraph and identify the variables and relationships:
*The narrative being sold is that the aging population is pushing hospitals to a breaking point. A study shows that pressure for beds leads patients to be discharged before they are well enough to go home. This simply leads to those patients returning to hospital and recorded as a new episode. The hospitals achieve their targets on throughput but fail to solve patient’s problems.*
# Why not have a go at identifying the variables in the paragraph yourself now?
I have highlighted the phrases I see which allude to variables in capitals:
*The narrative being sold is that the AGING POPULATION is pushing hospitals to a breaking point. A study shows that PRESSURE FOR BEDS leads patients to be DISCHARGED BEFORE THEY ARE WELL ENOUGH to go home. This simply leads to those PATIENTS RETURNING to hospital and RECORDED AS A NEW EPISODE. The hospitals achieve their TARGETS ON THROUGHPUT but fail to SOLVE PATIENT'S PROBLEMS.*
At its core the paragraph is describing a vicious cycle. This means we have a reinforcing loop. Here is one way we could capture this:

Hospital Beds Example CLD.
source
But more realistically, after some playing, I came up with this:
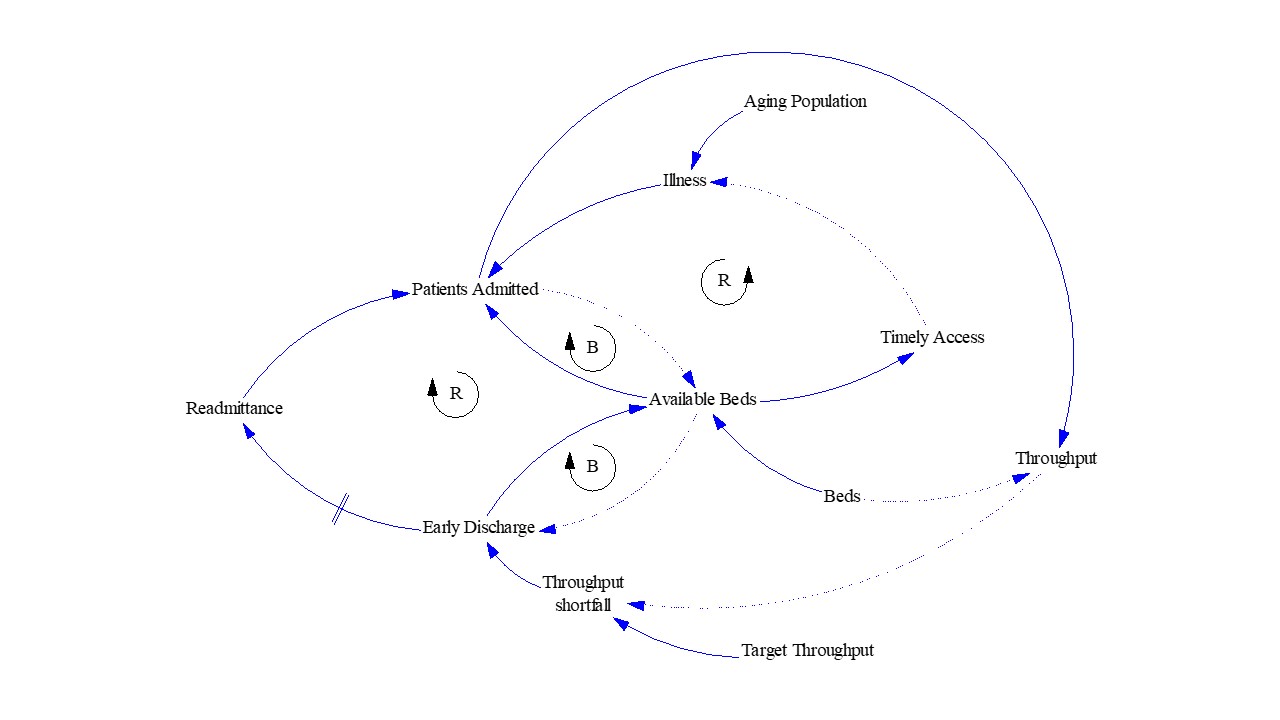
Hospital Beds CLD
See also Great Leap Backwards
We can also explore a system using a stock flow diagram (SFD). Some of the variables in our CLD are stocks (accumulations) and we change stock levels via flows. Here I have created an SFD for the hospital beds example:

Hospital Beds SFD.
source