
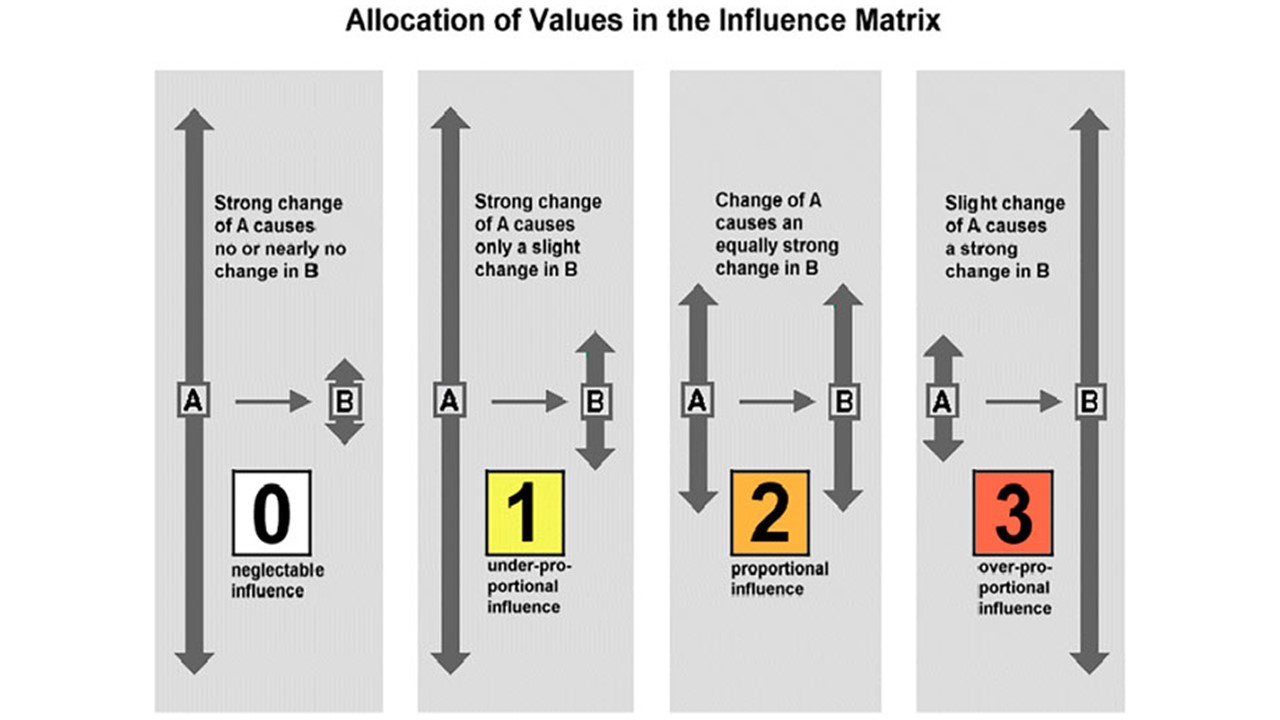
The next stage involves capturing our judgements about the strength of the relationships in the matrix (aka CLD.) We rate the strength as either:
0 = There is no *direct* relationship between these variables OR a strong change in the causal variable results in no, or nearly no, change in the affected variable.
1 = a strong change in the causal variable results in a slight change in the affected variable.
2 = a change in the causal variable results in an equally strong change in the affected variable.
3 = a slight change in the causal variable results in an strong change in the affected variable.
Input: Assessing impact of individual relationships
We capture our assessments in a spreadsheet with the variables listed in the first column and across the first row. We then assess the strengths using the 1/2/3 shown above.
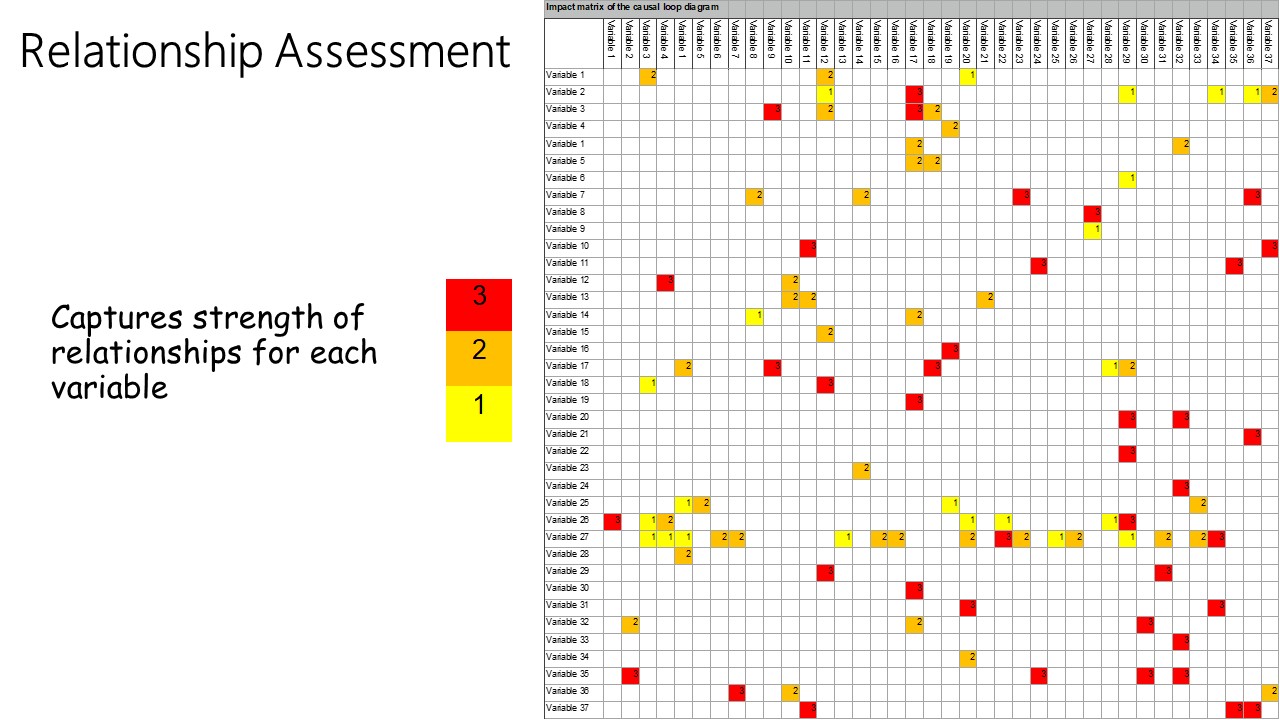
Example Relationship Strength Matrix
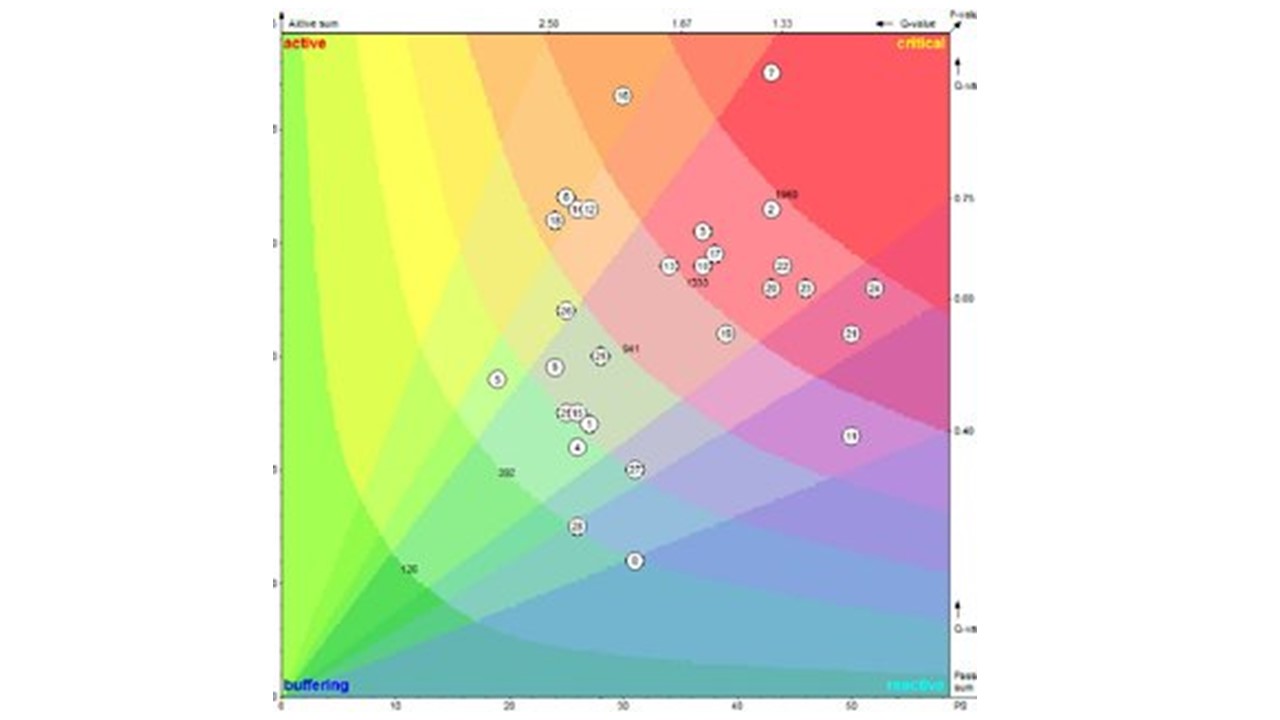
I have created a spreadsheet to do the calculations in the Vester book which then create the graph below of the power of each variable in the system.
Output: Impact Matrix
See Chapter 14 of Frederic Vester's report to The Club of Rome "The Art of Interconnected Thinking" Link ![]() . And this paper
. And this paper ![]() .
.
The next step in the Leverage Points Process is Identify Critical Drivers.