
# Vensim Method (PLE vn10.1.4)
1. Click the Causal Table Button (in the analysis tools to the left of your diagram.) This is located below the "Uses Tree" tool button and above the "Loops" tool button. This will create a new window containing the causal table for your diagram.
2. Where there is a relationship bewteen two variables in the CLD this will be represented in the relevant cell of the matrix by the line style you chose in the CLD.
2. Click on the "Copy" button at the top left of the causal table window.
3. Open a new Excel spreadsheet and paste the clipboard contents.
4. Where there is a relationship bewteen variables in the CLD there will be a "+-1" in that cell on the spreadsheet.
# Vensim Method (PLE vn10.1.3 and earlier)
1. Download the Variables from your vensim model. This will generate a CSV file.
2. Import the CSV file into Excel using Data - Get and Transform data - From Text/CSV. Variables will be listed in alphabetical order.
3. Delete the 4 rows containing the system variables that Vensim adds (INITIAL TIME , FINAL TIME, SAVEPER and TIMESTEP.)
4. Create another column and name it "Variable Number" or simply "No." Number the variables sequentially from 1 upwards.
5. Put the same numbers in the first row.
6. In Vensim, set the depth of the uses tree to 1 by following the instructions in 999 Driver Tree but selecting tree depth "1". Then in Vensim select each variable in turn by double clicking on it. Then click on the uses tree button. This will show all the variables that the selected variable affects directly.
7. Place a "1" in the relevant cells on the Excel matrix you created.
# Miro Method
1. Select the "stickies" (Variable names) you want and download them in a format for import to Excel.
2. Follow the same steps as the Vensim method (above) but there is no need for step 3 and step 6 is not possible in Miro. Step 6 will have to be carried out by identifying the arrows leaving each variable by eye.
# Paper Method
1. Type the variable names directly into Excel.
2. Follow steps 4 onwards in Vensim method (above) with the exception of step 6. As with the Miro method, step 6 will have to be carried out by identifying the arrows leaving each variable by eye.
# Example
Below you can see an example of a CLD with 31 variables.
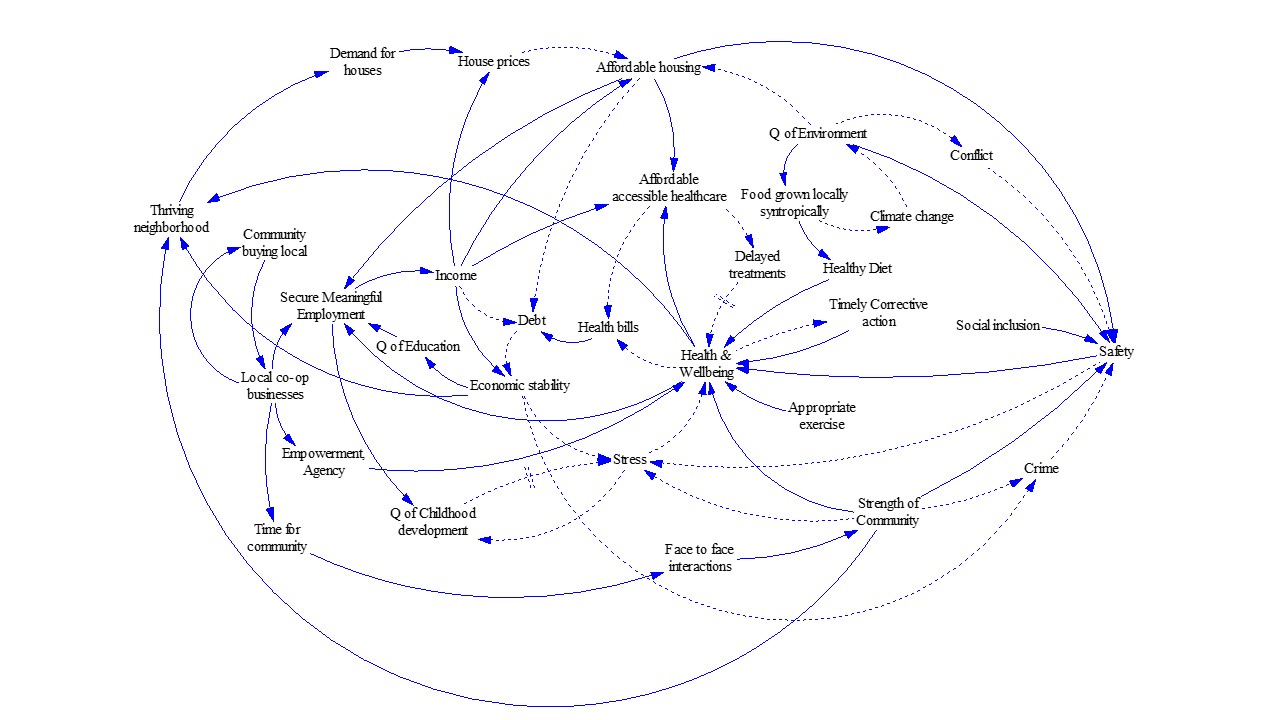
Exploring Health and Well Being CLD
The Matrix representation created in Excel is shown here. We can represent the inter-relationships between variables as either a CLD or a driver tree or a matrix. Note that they are all identical.
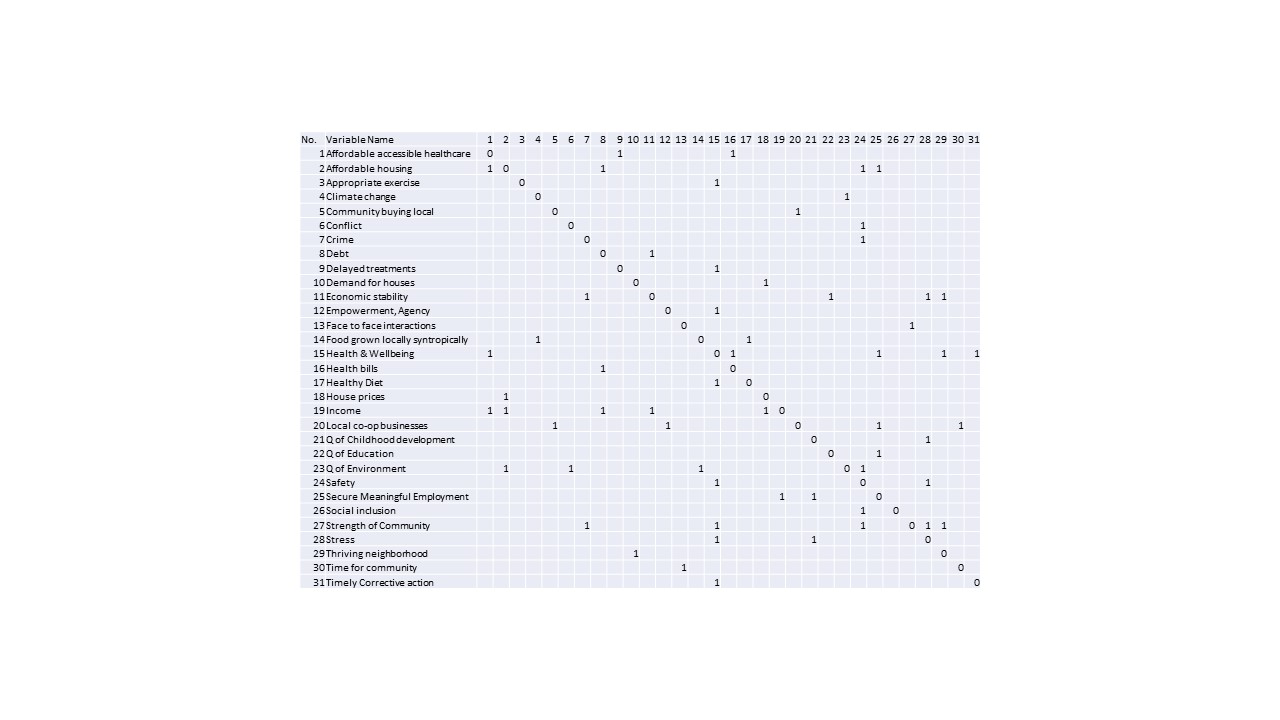
Health and Well Being Matrix of CLD
In this example I have left the cells blank where there is no relationship in the CLD. I think this is a good idea as in the next stage which is Capture Impact Assessments we can explicitly consider and confirm that there is no direct relationship and put a "0" then.
The next step in the Leverage Points Process is Capture Impact Assessments.